Note
Need help? Please let us know in the UMEP Community.
5.5. Urban Energy Balance: SUEWS Analyser
- Contributor
Name
Institution
Fredrik Lindberg
Gothenburg
- Introduction
The SUEWS Analyzer plugin can be used to make basic analysis of model results generated by the SUEWS Simple and SUEWS Advanced plugins.
- Dialog box
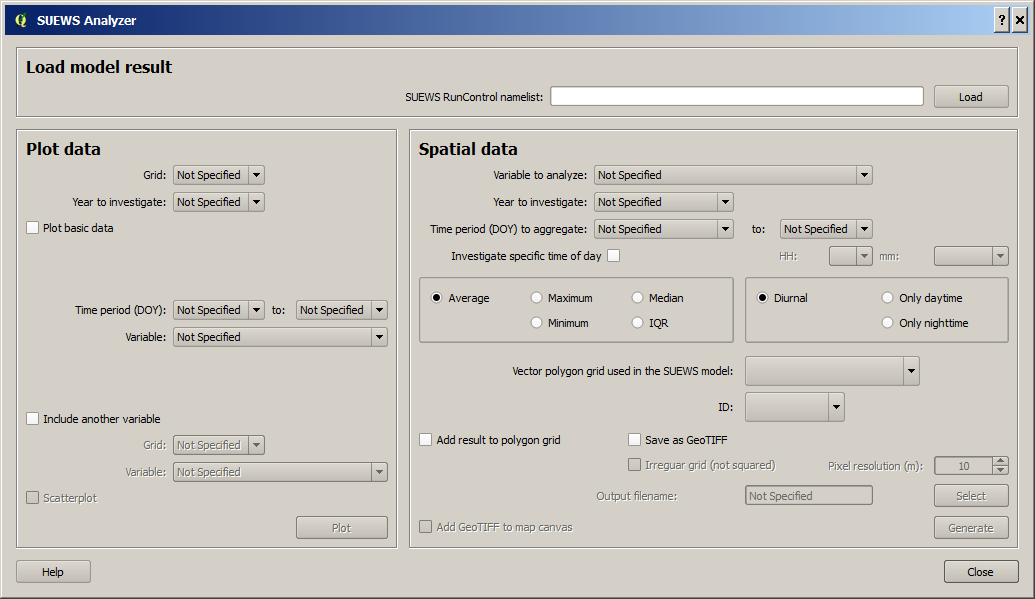
Fig. 5.6 The dialog for SUEWSAnalyzer
- Dialog sections
top
Model results to be analyzer is specified.
left
Plotting of time series derived from Points of Interest during model calculations in SUEWS
bottom
Analysis of spatial results from model calculations in SUEWS
- Load model result
A namelist (RunControl.nml) used for the model run should be specified. This can be located in the suewsmodel directory found as a sub-directory of the UMEP-plugin directory. Note that the namelist includes information on the last model run performed.
- Point data
Grid
Here, a list of all available modeled grids are listed. Specify one of the grid IDs. If no grid is available, then no data if found in the model output folder.
Year to investigate
Specify one of the available years to plot.
Plot basic data
Tick this in to plot a summary of the most essential output variables.
Time Period (DOY)
Specify the time period to plot.
Variable
Specify one of the available variables to plot.
Include another variable
Tick this in to add another variable in the plot.
Grid
Here, a list of all available modeled grids are listed. Specify one of the grid IDs. If no grid is available, then no data if found in the model output folder.
Variable
Specify one of the available variables to plot.
Scatterplot
Tick this in to generate a scatterplot between the two variables specified above.
Plot
Plot the data selected above
- Spatial data
Variable to analyze
Select a listed variable to process. If no variable is available, then no data if found in the Model output folder.
Year to investigate
Specify one of the available years to plot.
Time Period (DOY)
Specify the time period to plot.
Average
Tick this in to derive a grid-wise average.
Maximum
Tick this in to derive a grid-wise maximum.
Minimum
Tick this in to derive a grid-wise minimum.
Median
Tick this in to derive a grid-wise median value.
IQR
Tick this in to derive a grid-wise interquartile range.
Diurnal
Tick this in to include diurnal (all) data.
Daytime
Tick this in to include daytime data.
Nightime
Tick this in to include nighttime data.
Vector polygon grid used in the SUEWS model
Specify the grid that was used to generate the input data to the SUEWS model run of interest.
ID
Specify the attribute ID used to generate the input data to the SUEWS model run of interest.
Add result to polygon grid
Tick this box to add the results in the attribute table of the grid specified.
Save of GeoTIFF
Tick this in to generate a raster grid from the analyze settings specified.
Irregular grid (not squared)
Tick this in if a grid is irregular i.e. not squared and aligned north to south.
Pixel resolution (m)
When a irregular grid is used, a pixel resolution in meters must be specified.
Output filename
Name of the GeoTIFF to be saved.
Add analysis to map canvas
All analysis specified above will be added to the map canvas if this box is ticked in.
Generate
Starts the spatial processing/analysis.
- Close
This closes the plugin.