Note
Need help? Please let us know in the UMEP Community.
3.5. Spatial Data: LCZ Converter
Contributor:
Name |
Institution |
|---|---|
Natalie Theeuwes |
Reading |
Andy Gabey |
Reading |
Fredrik Lindberg |
Gothenburg |
Sue Grimmond |
Reading |
- Introduction
The Local climate zone (LCZ) converter calculates land cover fractions (see land cover reclassifier) on a vector grid based on LCZ raster maps from the WUDAPT portal. The local climate zone are urban area classified based on the Stewart and Oke (2012) scheme.
The raster LCZ maps can be converted into maps of land cover fraction and morphometric properties. For this conversion we use paved, building and pervious fraction for each LCZ from Stewart et al. (2014). However, what exactly the pervious fraction consists of (grass, trees, bare soil or water) needs to be user-specified. Similarly, morphometric properties for the buildings are specified in this scheme, but the vegetation morphometric properties still need to be specified by the user.
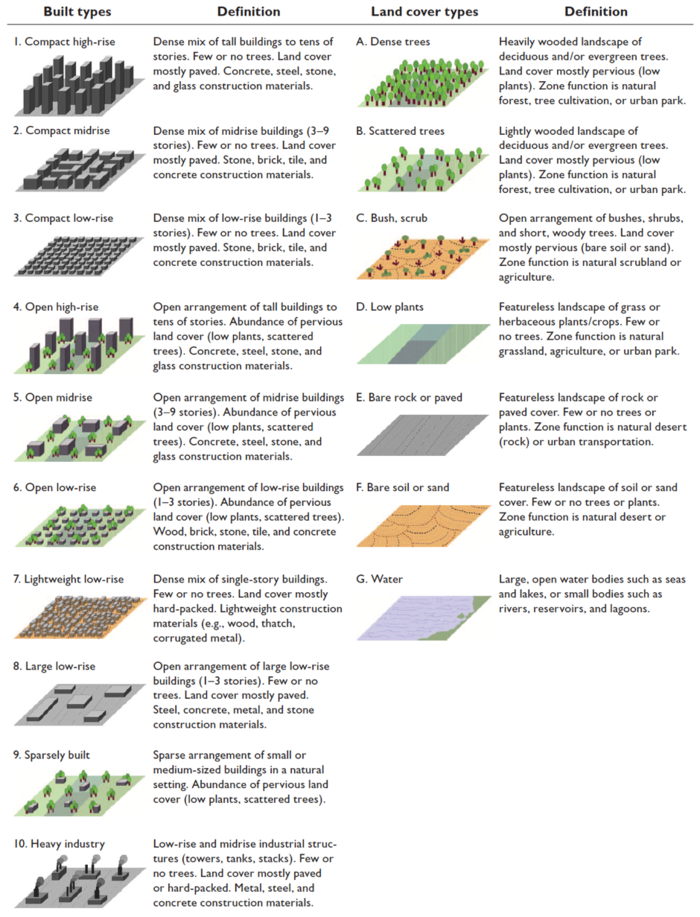
Fig. 3.6 The definition of the different local climate zones (LCZ)
Note
In UMEP we refer to the rural LCZ’s as 101, 102, 103, 104, 105, 106 and 107 instead of A, B, C, D, E, F and G.
- Dialog box
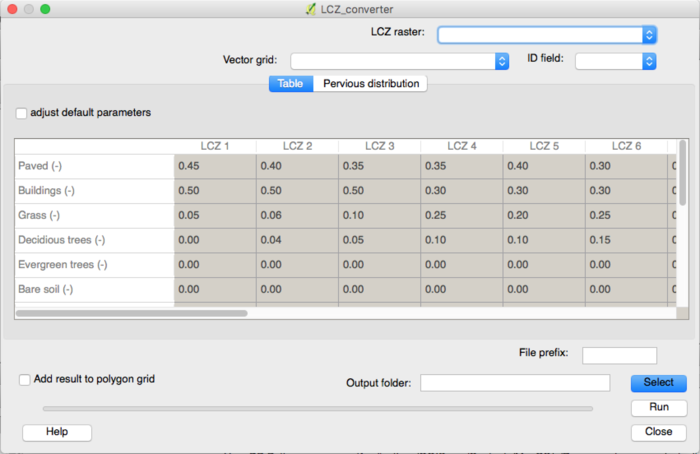
The first tab in the LCZ converter dialog shows a table. This table includes land cover fractions and morphometric properties for buildings and vegetation for each local climate zone. If the default values in the table are not appropriate for the selected city the user has a choice between editing the table directly or using the “pervious distribution” tab in order to provide approximate values for the distribution between grass, bare soil, trees and water and the height of the vegetation.
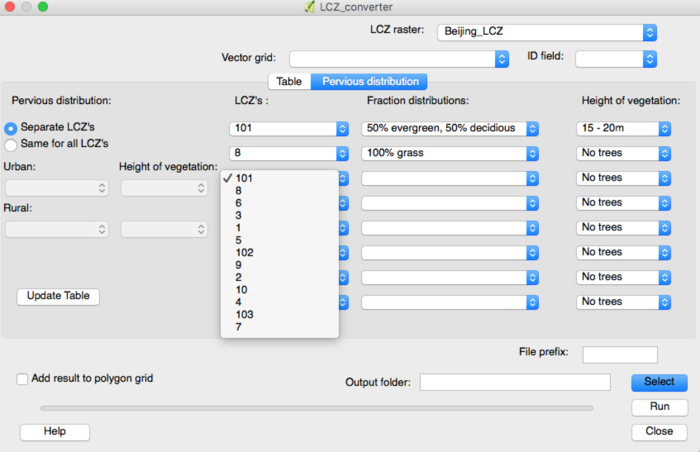
Within the “pervious distribution” tab there are two options to change the pervious fraction distribution: Either per LCZ using the “Separate LCZ’s” button or for all LCZ’s together using “Same for all LCZ’s”. When selecting the first option make sure to select the LCZ raster first. Based on the LCZ raster, the dropdown boxes will show the LCZ classes ordered by the frequency of occurrence. Select the classes to specify the pervious distributions for and select the most appropriate pervious land cover options and vegetation heights.
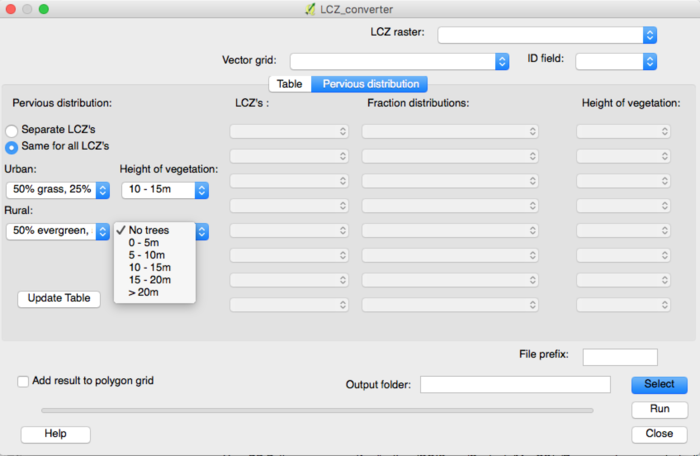
When choosing the “Same for all LCZ’s” option: choose the appropriate pervious land cover fractions and vegetation heights for all urban and all rural LCZ classes.
Dialog sections
upper |
Select the LCZ raster layer and the vector grid the land cover fractions should be computed for. |
middle Tab: Pervious distribution |
Set the distribution of pervious surface fractions for each LCZ separately or all at the same time. |
middle Tab: Table |
Alters the land cover fractions and building and vegetation heights for each LCZ towards more accurate values. |
lower |
Specify output and run the calculations. |
- LCZ raster
Select the LCZ raster from the WUDAPT database.
- Vector grid
Select your predefined polygon grid (see Vector -> Research Tools -> Vector Grid; select polygons not lines)
- Adjust default parameters
Tick this box if you would like to edit the table below with the land use fractions and tree and building heights for each of the local climate zones.
- Separate LCZ’s
Once selected it computes the most common LCZ classes in the Raster grid and allows you to alter the pervious fractions and tree heights in the dropdown boxes to the right for each individual LCZ.
LCZ’s: |
List of LCZ’s in the raster, ordered by most frequent occurrence. Select the LCZ(s) for which you would like to specify the pervious fraction. |
Fraction distributions: |
Select the percentages of each pervious land cover class for the selected LCZ. |
Height of trees: |
Select the range of tree heights most applicable for that LCZ. |
- Same for all LCZ’s
Allows you to alter the pervious fractions and tree heights for all urban and rural classes at the same time.
Urban: |
Select the percentages of each pervious land cover class for all urban LCZ’s. |
Rural: |
Select the percentages of each pervious land cover class for all rural LCZ’s. Note for rural classes you are only able to specify the distribution of tree species. |
Height of trees: |
Select the range of tree heights most applicable for the urban and rural LCZ’s. |
- Update Table
This updates the table from the default values to the user-specified distributions of the pervious fractions. Please check the table, to make sure your changes have taken effect.
- File Prefix
A prefix that will be included in the beginning of the output files.
- Add results to polygon grid:
Tick this in if you would like to save the results in the attribute table for your polygon vector grid.
- Output Folder
A specified folder where result will be saved.
- Run
Starts the calculation
- Close
Closes the plugin.
- Output
- Three files are saved after a successful run.
One with the landcover fractions for each grid cell
One with the morphometric properties for the building for each grid cell
One with the morphometric properties for vegetation for each grid cell
- Remarks
Rural LCZ’s are marked as 101, 102, etc instead of A, B, etc.
Issues using .sdat rasters has been reported. GeoTiffs are recommended.
- References
Stewart, I.D. and Oke, T.R. 2012. Local Climate Zones for urban temperature studies. Bulletin of the American Meteorological Society, 93: 1879-1900.
Stewart, I.D., Oke, T.R., and E.S. Krayenhoff. 2014. Evaluation of the ‘local climate zone’ scheme using temperature observations and model simulations. International Journal of Climatology, 34: 1062-80.