Note
Need help? Please let us know in the UMEP Community.
4.1. Outdoor Thermal Comfort: ExtremeFinder
- Contributor
Name
Institution
Bei Huang
Reading
Andy Gabey
Reading
Fredrik Lindberg
Gothenburg
- Current Options
Identifies extreme high events (e.g. Heat waves) and low events (e.g. Cold Waves). Designed primarily for temperature data (heat waves identified from daily maximum and mean T; cold waves from daily minimum), but can also be used to indicate potential high and low extremes in other meteorological variables.
- Data must be provided by the user, and can be
Previously-downloaded ERA5 data in a NetCDF (*-scf.nc) file (this can be obtained from the ERA5 downloader)
Other NetCDF (.nc) file containing sub-daily measurements, or daily maximum/mean/minimum values. Must contain a ‘time’ dimension, and variable(s) with name(s) matching those being analysed using the ExtremeFinder.
Text (.txt) file, daily Tmax, Tavg or Tmin (file sample: 1979-01-01 to 2009-12-31). Only temperature analysis can be performed using a text file.
- Method
- Basis for thresholds - set into Input.nml (namelist)
Meehl and Tebaldi (2004): 81st, 97.5th
Fischer and Schär (2010): 90th
Vautard et al. (2013): 90th
Schoetter et al. (2014): 98th
Sirje Keevallik (2015): 10th
A. K. Srivastava (2009): 3 °C
Busuioc et al. (2010): 5 °C
- Dialog box
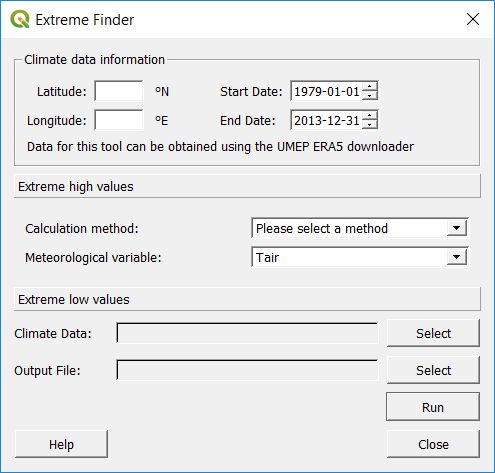
Fig. 4.1 The interface for the ExtremeFinder plugin
- Steps to use
Select climate data: The ExtremeFinder will use all the data available in its analysis. You will be prompted for a text (.txt) or NetCDF (.nc) file:
NetCDF file: The latitude, longitude, start and end date boxes will be populated automatically, if the data is available in the NetCDF file.
Text file: The latitude, longitude, start and end date boxes must be filled in by the user, as the information is needed in calculations:
Latitude (degrees N) and Longitude (degrees E) are WGS84 co-ordinates
Start and end date are inclusive and must match the data extent
Select the extreme event type and the calculation method:
Event types are either Extreme high (e.g. Heat wave) or low (e.g. Cold wave)
There are several different ways to identify extremes, depending on the event type
Choose the meteorological variable to analyse for extremes
Note: The methods in the Extreme Finder are based on Tair and may not be appropriate for other variables
Select Output File: A list of extreme events will be written to the file
Note: this will be overwritten if not a new name
Run: Performs the analysis
- Output: Extreme events (heat waves used as example below)
Daily Tmax (or Tavg / Tmin) with time (Y=Year, X=Month)
Colour gives Temperature (see key)
Yellow Box Highlights Heatwave (Coldwave) periods This loads the model interface dialog box:
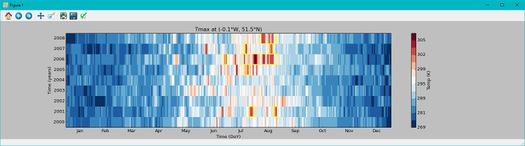
Fig. 4.2 Heat/Cold wave periods
Box plot of distribution of heat (cold) wave by year.
whiskers =1.5* IQR
outliers - any data beyond the whiskers
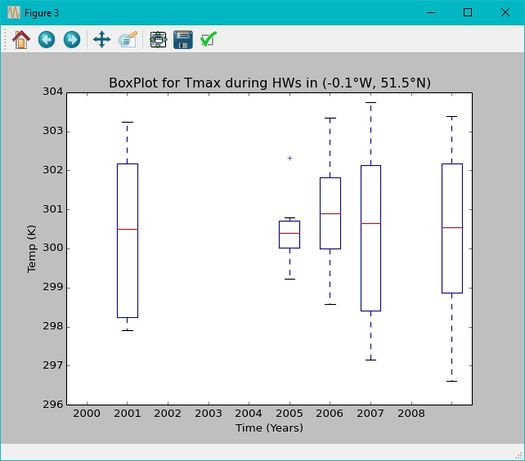
Fig. 4.3 Box-and-whisker plot of Heat/Cold wave days each year
Number of heat (cold) waves days per year
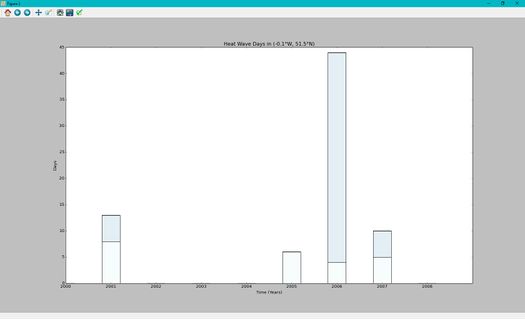
Fig. 4.4 Histogram showing number of Heat/Cold wave days each year