The pre-processor SUEWS Prepare generates surface-related input data from geographical data for SUEWS, the Surface Urban Energy and Water Balance Scheme. SUEWS (Järvi et al. 2011, 2014; Ward et al. 2016a, b) simulates the urban radiation, energy and water balances using commonly measured/modelled meteorological variables and information about the surface cover. It utilizes an evaporation-interception approach (Grimmond et al. 1991), similar to that used in forests, to model evaporation from urban surfaces. The surface state for each surface type at each time step is calculated from the running water balance of the canopy where the evaporation is calculated from the Penman-Monteith equation. The soil moisture below each surface type (excluding water) is also taken into account.
Terminology:
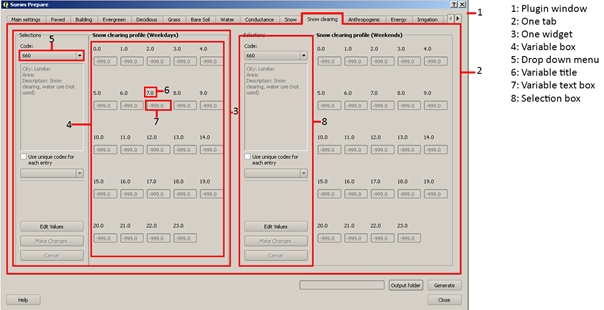
Components of the plugin window:
Fig. 3.15 Some naming conventions used in this document relating to the components of the plugin.
Plugin window:
Dialog window of the plugin. Any user interface components that are part of the plugin will be a part of the plugin window.
Tab:
The plugin contains many tabs. The tabs can be cycled through to reveal different kinds of information.
Widget:
One tab can contain one or more widgets. One widget contains two boxes, the selection box and the variable box.
Variable box:
Right part of a widget It contains a number of variables. One variable is comprised of a variable title and a variable text box.
Drop down menu:
The drop down menu allows a selection from a predetermined range of values.
Variable title:
The variable title is a short description of the variable.
Variable text box:
The variable text box contains the value of the variable for one site entry.
Selection box:
The selection box is the left part of a widget. It contains a number of user interface components such as buttons and drop down menus.
Terms relating to data used by the plugin (For more info see developer section below):
Site Library:
The site library contains all collected sites (i.e. study areas) and information about those sites.
Site code:
A site code separates site entries of one kind from each other. It needs to be a unique integer number.
Identification code:
The identification code is used when there is a need to separate site entries into categories. If two site entries share the same identification code they belong to the same category.
3.11.1. Using the plugin - The different components of the plugin and the plugin output:
Main window:
The main window contains all the user interface components of the plugin. Navigation uses tabs, with each providing some of the information needed. The are two categories:
main settings tab
site library (all other tabs)
The main window has buttons to specify to:
indicate the folder where the output will be generated
to start the process of generating the output
to close the main window.
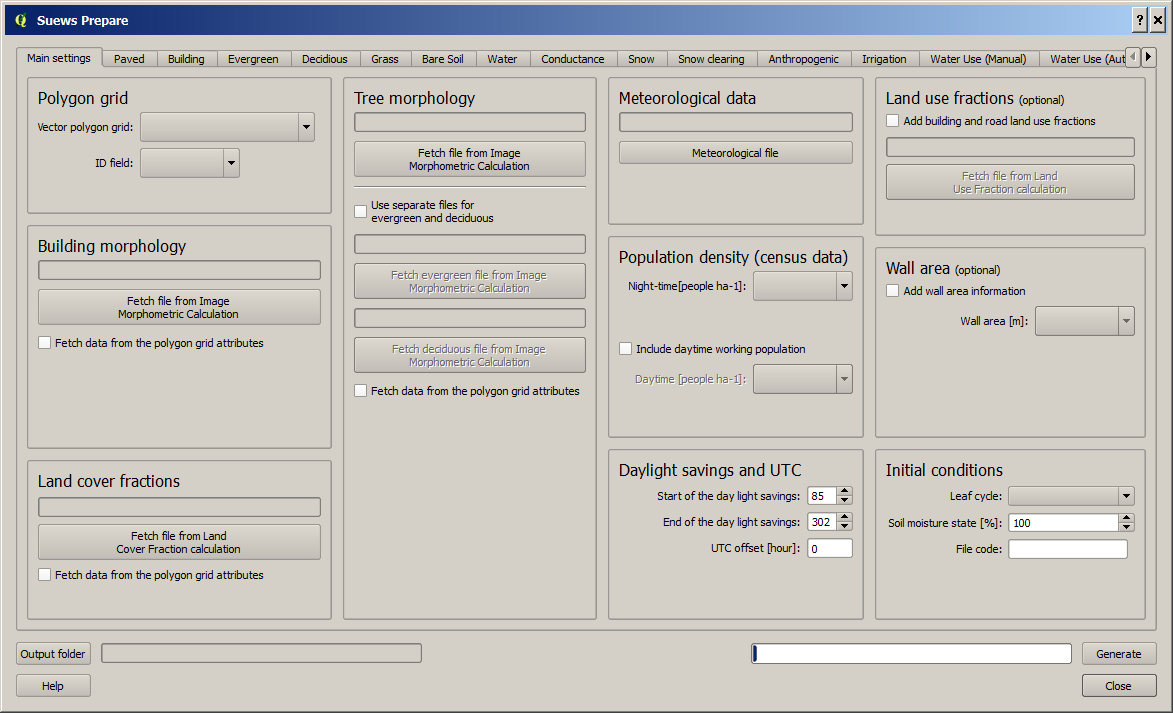
Main settings tab:
The main settings tab is where the plugin is provided with inputs from outside sources such as text files and vector layer attributes. Basically anything that is not part of the site library.
Fig. 3.16 Plugin window with the main settings tab selected
Polygon grid:
The polygon grid is used to provide the plugin with further information through the grid attribute table. Each part of the grid will create a separate entry in the plugins output. The polygon grid can be in any vector file format compatible with QGIS, however, it is recommended to use the shape file format.
To use an existing polygon grid layer in the plugin add the layer to the QGIS interface. This can be done either by dragging and dropping the file into the QGIS program or by using the menu Layers. Any polygon layers added to the QGIS interface can then be selected for use in the plugin from the drop down menu in the main settings tab marked Vector polygon grid If no polygon grid layer is available, there are several opportunities to create these in QGIS. We recommend to make use of the built-in Create Grid in the processing toolbox.
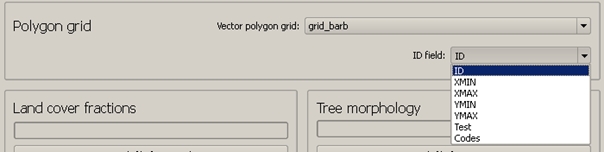
When a relevant polygon grid has been selected for the plugin several separate drop down menus allow for data to be collected from the fields in the polygon grid attribute table. The initial selections in these drops down menus might not be correct and needs to be manually corrected by the user.
The input in the drop down menu marked ID field in the box for polygon grid selection needs to correlate with the polygon layers attribute field for feature ids or any attribute field containing unique integer numbers. The polygon layer should be in a coordinate system that can be related to both lat/lon coordinates as well as meters. The polygon features included in the polygon vector grid can be of any shape and size.
Data for land cover fractions, building morphology and tree morphology:
To use SUEWS land cover and morphology data for buildings and vegetation are needed. This information can be acquired through other plugins in UMEP. This data can then be added into SUEWSPrepare by two different options:
Import the data as text
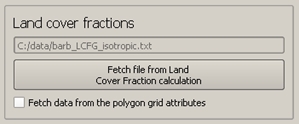
To do this click the buttons in the boxes associated with these types of data and follow the import dialogs to select the correct text file. When a file has been selected the file path will be shown in the text boxes above the buttons. The text files on land cover and morphology are generated with the Land Cover Fraction plugin and the Image Morphometric Calculator, respectively.
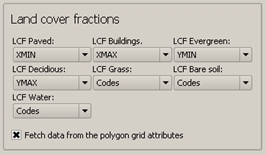
Alternatively, the data need to be available in the attribute table of the polygon layer. If the data are available in this format simply check the check boxes below the buttons to change the interface from buttons into drop down menus. In the drop down menus select the correct attribute fields for the data and the selection is done.
Fig. 3.18 Box associated with land cover fractions data. The button has been used to import a file containing land cover fraction data.
Fig. 3.19 Box associated with land cover fractions when the checkbox is checked. The drop down menus can be used to import land cover fraction data.
Meteorological data:
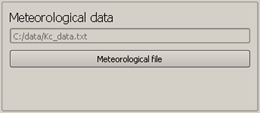
The meteorological data have to be imported from a text file. Use the button in the box for meteorological data, follow the dialog and select the correct text file. The meteorological data used in the various UMEP-plugins is format specific and can be generated from other data sources using the MetPreprocessor plugin. There you can also find more information on what parameters are required in the meteorological dataset.
Fig. 3.20 Box for meteorological data. The button has been used to import a file containing meteorological data.
Daylight savings time:
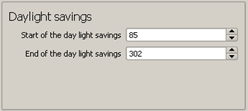
The plugin needs to have access to the correct days in which the switches to and from daylight savings time occurs in the region. The numbers in the text boxes represent the days of year. For example, the 21st of January is day of year 21 and the 2nd of February is day of year be 33 and so on. Make sure the days in the text boxes for daylight savings time in the main settings tab are correct for your region.
Fig. 3.21 Box used for setting the start and end of day lights savings time.
Population density:
This data needs to be added through the polygon grid attribute table. Make sure that the data exist as an attribute field and select it in the drop down menu.
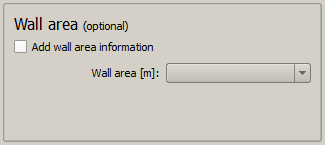
Wall area (optional) :
This data needs to be added through the polygon grid attribute table. Make sure that the data exist as an attribute field and select it in the drop down menu. This can be calculated from a DSM using the Wall height and aspect calculator.
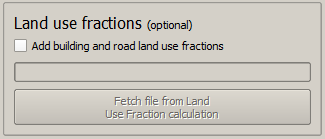
This data needs to be added through a text file. Information needed is land use fractions for impervious and building land cover classes. It is possible to include three impervious and five building classes. The format of the text file should be:
where f is fraction, LU is land use and p is paved. Fractions must add up to 1 for paved and buildings respectively. A plugin to generate this text file is not yet created.
The SUEWS model requires information of initial conditions. SUEWSPRepare generates some basic information used to create a file called InitialConditionsXXXX_YYYY.nml where XXXX is the ID grid number.
.. figure:: /images/SUEWSPrepare_init.png
Box for initial conditions.
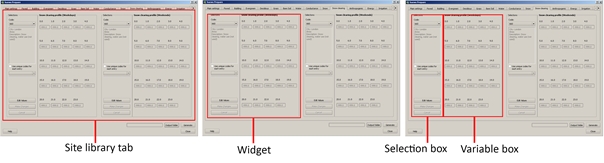
Site library tabs :
The remaining tabs besides the main settings tab all fall under the same category, namely site library tabs. A site library tab represents certain characteristics of an area. A tab can consist of one or more widgets. Each widget has a predetermined layout but will represent different kinds of information. The left part of a widget can be used to select a site entry for the plugin output or to create a new entry to the site library. The right part of a widget will show information about a site through variables.
Fig. 3.24 Some of the components of a site library tab.
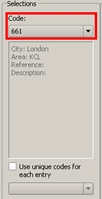
Selecting a site :
The selection of a site is done through a drop down menu marked “Code”. The codes in the drop down menu represent the site codes for a site. Each code represents one site entry. Selecting a code will show the values of the variables for the site entry in the variable box the right side of the tab. The code selected will be used in the output of the plugin.
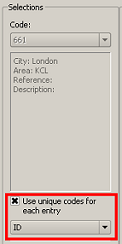
It is possible to use separate codes for each feature in the polygon grid. This requires a field in the polygon grid attribute table that represent the code that is to be used for each feature. If there is such a field click the checkbox marked “Use unique codes for each entry” and select the correct field from the drop down menu.
Fig. 3.25 Site code selection in a site library tab
To create a new site entry click the button marked “Edit values”. This will make the text boxes for the variables in the right box available for editing. When you are satisfied with the changes press the button marked “Make changes”. This will show a dialog window that will ask you to provide a site code for your new entry and some description of the site you are adding. After this information is provided you are also able to add an optional url to a picture that represent the site.
Plugin Output:
In the output folder specified, a number of text files needed as input for the SUEWS model is created. These can be used in conjunction with SUEWS/BLUEWS (Advanced). Also, see the SUEWS manual for more information.