Note
Need help? Please let us know in the UMEP Community.
5.2. Outdoor Thermal Comfort: SOLWEIG Analyzer
- Contributor
Name
Institution
Fredrik Lindberg
Gothenburg
- Introduction
The SOLWEIG Analyzer plugin can be used to make basic analysis of model results generated by the SOLWEIG plugin.
- Dialog box
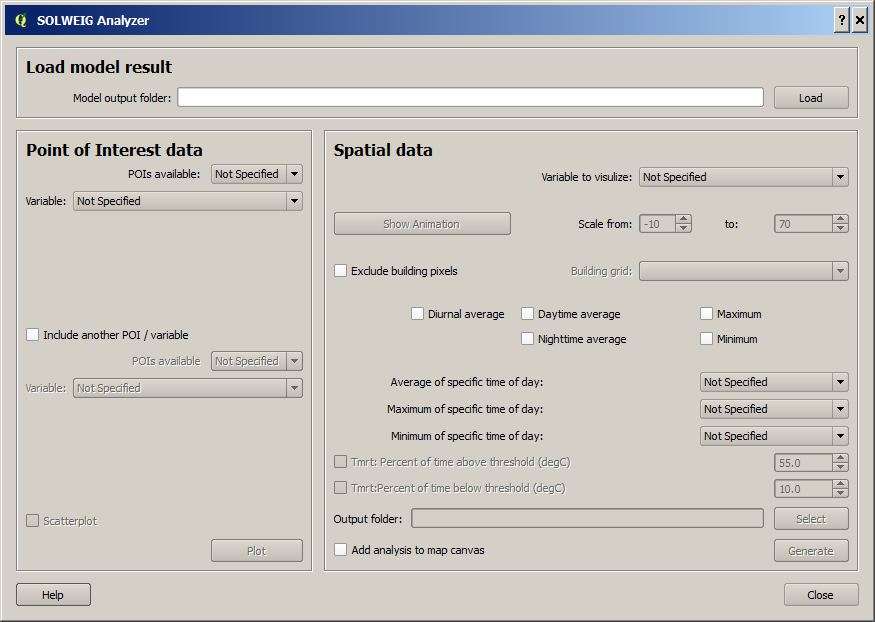
Fig. 5.2 Dailog for SOLWEIG Analyser
- Dialog sections
top
Input data is specified. Should be pointing towards a directory where result from a SOLWEIG model run has been saved.
left
Plotting of time series derived from Points of Interest during model calculations in SOLWEIG
bottom
Analysis of spatial results from model calculations in SOLWEIG
- Load model result
The directory where results from a previous model run in SOLWEIG is located.
- Point of Interest data
POIs available
Here, a list of all available POI files are listed. Specify one of the POIs. If no variable is available, then no data if found in the Model output folder.
Variable
Specify one of the available variables to plot.
Add another POI / variable
Tick this in to add another variable in the plot.
Scatterplot
Tick this in to generate a scatterplot between the two variables specified above.
Plot
Plot the data selected above
- Spatial data
Variable to visualize
Select a listed variable to process. If no variable is available, then no data if found in the Model output folder.
Show animation
This produces a time-related animation of the selected variable scaled based on the settings to the left in the GUI.
Exclude building pixels
Tick this in to exclude building pixels using a building grid generated from the SOLWEIG run. The building grid must have the same extent and pixel resolution as the generated output maps in the model output folder.
Diurnal average
Tick this in to include all grids for the selected variable to derive a pixelwise average.
Daytime average
Tick this in to include all daytime grids for the selected variable to derive a pixelwise average.
Nightime average
Tick this in to include all nighttime grids for the selected variable to derive a pixelwise average.
Maximum
Tick this in to get the pixelwise maximum for the selected variable.
Minimum
Tick this in to get the pixelwise minimum for the selected variable.
Average of specific time of day
The average of the selected time of day for the variable selected is generated. If ‘Not Specified’ is highlighted, no grid will be generated.
Maximum of specific time of day
The maximum of the selected time of day for the variable selected is generated. If ‘Not Specified’ is highlighted, no grid will be generated.
Minimum of specific time of day
The minimum of the selected time of day for the variable selected is generated. If ‘Not Specified’ is highlighted, no grid will be generated.
Tmrt: Percent of time above threshold (degC)
If Tmrt is the selected variable, this box become active and calculates the percent of time that Tmrt for each is above the threshold specified to the right.
Tmrt: Percent of time below threshold (degC)
If Tmrt is the selected variable, this box become active and calculates the percent of time that Tmrt for each is below the threshold specified to the right.
Output folder
Directory where the results specified above will be saved.
Add analysis to map canvas
All analysis specified above will be added to the map canvas if this box is ticked in.
Generate
Starts the spatial processing/analysis.
- Close
This closes the plugin.