Note
Need help? Please let us know in the UMEP Community.
5.9. Urban Wind Fields: URock Analyzer
Note
This plugin is still experimental. Please report any issues to our code repository.
- Contributor
Name
Institution
Jérémy Bernard
Gothenburg
- Introduction
The URock plugin can be used to calculate spatial variations of wind speed and wind direction in 3 dimensions using 2.5D building and vegetation data. The methodology originates from Röckle (1990), has been implemented in proprietary softwares such as QUIC-URB (Brown et al., 2013) or SkyHelios (Fröhlich and Matzarakis, 2018) and is further described in Bernard et al., 2023. The current version of the model is 2023a.
The URock Analyser plugin can be used to plot the results obtained using the Urban Wind Fields: URock model along the vertical axis. This plugin is available only from UMEP for processing.
- Dialog box
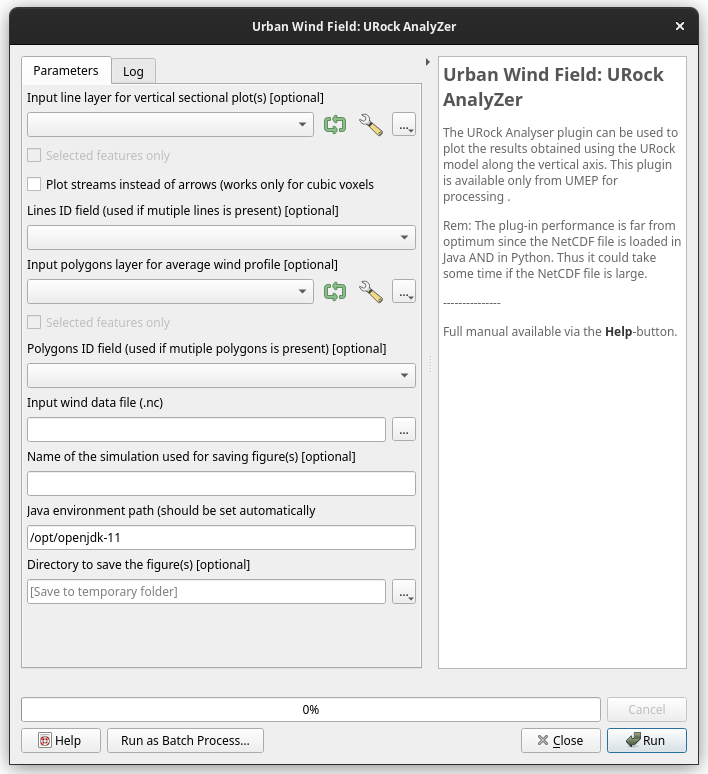
Fig. 5.11 The dialog for the UWG Analyser in UMEP for processing. Click on image for enlargement.
- Parameters
Input lines layer (optional)
Vector file containing lines that will be used for plotting sectional view of the Urban Wind Fields: URock results.
Lines ID field (optional)
Attribute used to identify each line (and thus each figure at the end of the process).
Tick if you want the ‘line’ figure using streams instead of arrows
By default, the sectional view uses arrows to show wind speed and direction. Tick in to use streams to better show recirculations.
Input polygons layer (optional)
Vector file containing polygons that will be used to plot mean horizontal wind speed profiles.
Polygons ID field (optional)
Attribute used to identify each polygon (and thus each line on the plot).
Input wind data file (.nc)
URock output NetCDF file to use as input of the plugin.
Name of the simulation used for saving figure(s) (optional)
This name has only matter for saving purpose.
Java environment path (should be set automatically)
Java is used for some calculation and Python needs to know what is the Java environment path on your computer (a default value should be identified automatically)
Directory to save the figure(s) (optional)
A folder path where will be saved the output files
- Run
Starts the algorithm.
- Help
Link to this manual page.
- Close
Closes the plugin.
- Remarks
The plug-in performance is far from optimum since the NetCDF file is loaded in Java AND in Python. Thus it could take some time if the NetCDF file is large.
- References
Bernard, J., Lindberg, F., and Oswald, S.: URock 2023a: an open-source GIS-based wind model for complex urban settings, Geosci. Model Dev., 16, 5703–5727, https://doi.org/10.5194/gmd-16-5703-2023, 2023.
Brown, Michael J., Akshay A. Gowardhan, Mathew A. Nelson, Michael D. Williams, et Eric R. Pardyjak. « QUIC transport and dispersion modelling of two releases from the Joint Urban 2003 field experiment ». International Journal of Environment and Pollution 52, nᵒ 3‑4 (1 janvier 2013): 263‑87. https://doi.org/10.1504/IJEP.2013.058458.
Fröhlich, Dominik, et Andreas Matzarakis. « Spatial Estimation of Thermal Indices in Urban Areas—Basics of the SkyHelios Model ». Atmosphere 9, nᵒ 6 (juin 2018): 209. https://doi.org/10.3390/atmos9060209.