Note
Need help? Please let us know in the UMEP Community.
5.5. Solar Radiation: SEBE (Visualisation)
- Contributor
Name
Institution
Niklas Krave
Gothenburg
Introduction
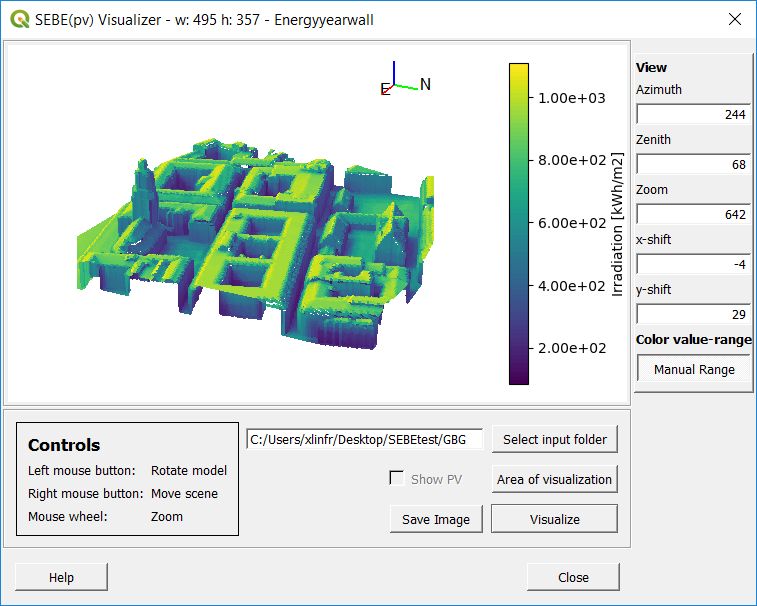
The SEBE (Visualisation) plugin can be used to visulise 3D output from model results generated by the SEBE plugin.
- Dialog box
Fig. 5.6 The dialog for SEBE Visualisation
- Dialog sections
top
Canvas for visualisation
bottom
Input data and settings
- Select input folder
The directory where results from a previous model run in SEBE is located.
- Area of visualisation
When this push button is clicked, a recanglge can be drawn on the map canvas. This is the area that will be visulised.
- Close
This closes the plugin.