In this tutorial you will use a model TreePlanter to optimize tree arrangements
to mitigate high radiant load on a square in Gothenburg, Sweden.
TreePlanter is a model that optimizes tree arrangements to mitigate
radiant load (represented by the mean radiant temperature (Tmrt))
using meta-heuristic algorithms. There are currently
two algorithms available: hill-climbing and greedy. In short, the
hill-climbing algorithm is more precise compared to the greedy
algorithm. On the other hand, the hill-climbing algorithm requires
many more computations, which increases model runtime. The hill-climbing
algorithm is recommended for a low number of trees and a small planting
area. You can read more about TreePlanter in the TreePlanter description page.
The model requires output data from a SOLWEIG run, which is based on
meteorological forcing data (global shortwave radiation (Kdown),
air temperature (Ta), relative humidity (RH)), urban geometry (DSMs),
and geographic information (latitude, longitude and elevation). To determine
Tmrt, continuous maps of sky view factors are required. Both vegetation
and ground cover information can be added to increase the accuracy of the model
output from SOLWEIG. Last but not least TreePlanter requires a Planting area in the form of
a Vector polygon layer.
UMEP is a python plugin used in conjunction with
QGIS. To install the software and the UMEP
plugin see the getting
started
section in the UMEP manual.
As UMEP is under constant development, some documentation may be missing
and/or there may be instability. Please report any issues or suggestions
to our repository.
The dataset for this tutorial can be downloaded from here.
Download TreePlanterTestData.zip, extract all files and add the raster layers (DSM, CDSM and DEM) and
the planting_area.shp vector layer from the TreePlanterTestData folder
into a new QGIS session (see below).
Create a new project
Examine the geodata by adding the layers (DSM,
CDSM and DEM) to your project (Layer
> Add Layer > Add Raster Layer).
Coordinate system of the grids is Sweref99 1200 (EPSG:3007). If you
look at the lower right hand side you can see the CRS used in the
current QGIS project.
Examine the different datasets before you move on.
Details of the model inputs and outputs are provided in the SOLWEIG
manual. As the focus of
this tutorial is to run TreePlanter, only the most critical
parameters are used. Many other parameters can be modified to more
appropriate values, if applicable.
Meterological input data should be in UMEP format. You can use the
Meterological Preprocessor
to prepare your input data. The meteorological input data from TreePlanterTestData is already prepared.
Required meteorological data is:
Air temperature (°C)
Relative humidity (%)
Incoming shortwave radiation (W m2)
The model performance will increase if diffuse and direct beam solar radiation is available but the model can also calculate
these variables using a statistical model (Reindl el at. 1990) from global radiation.
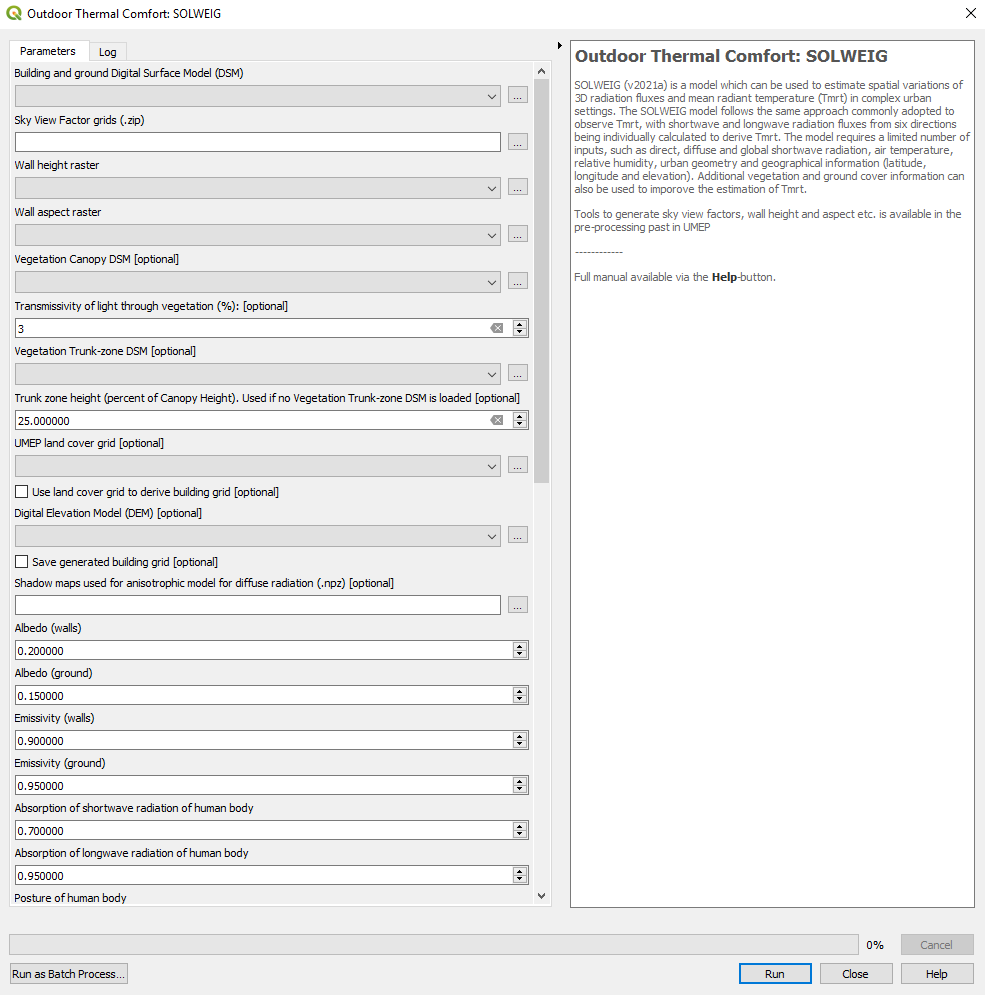
How to Run SOLWEIG from the UMEP processing plugin
Open SOLWEIG from UMEP -> Processor -> Outdoor Thermal Comfort : Solweig v2022a in the Processing Toolbox.
You will make use of a test dataset from observations for Gothenburg, Sweden.
Fig. 109 Dialog for the SOLWEIG model (click on figure for larger image)
To be able to run the model, some additional spatial datasets needs to
be created.
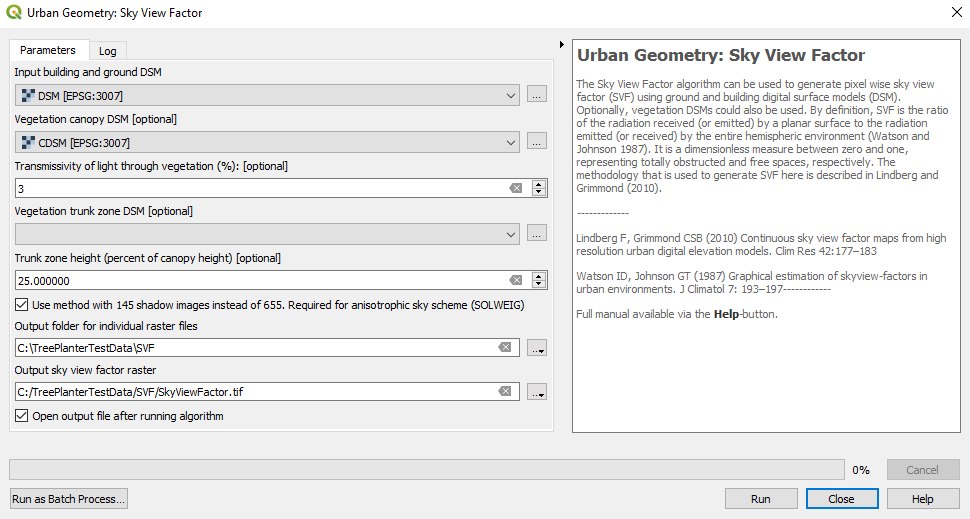
Close the SOLWEIG plugin and open UMEP -> Pre-Processor -> Urban
geometry -> Sky View Factor.
To run SOLWEIG various sky view factor (SVF) maps for both
vegetation and buildings must be created (see Lindberg and
Grimmond
(2011)
for details).
You can create all SVFs needed (vegetation and buildings) at the
same time. Use the settings as shown below. Use an appropriate
output folder for your computer.
Fig. 110 Settings for the SkyViewFactorCalculator.
If you look in your output folder you will find a zip-file containing all the
necessary SVF maps needed to run the SOLWEIG-model.
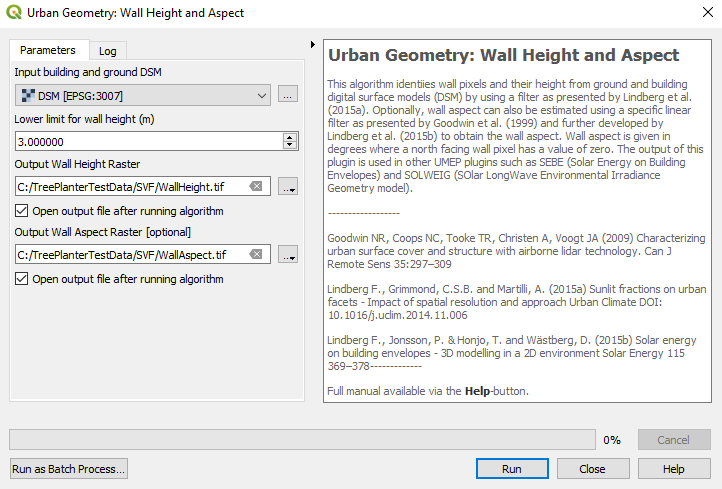
Another pre-processing plugin is needed to create the building wall
heights and aspect. Open UMEP -> Pre-Processor -> Urban geometry ->
Wall height and aspect and use the settings as shown below. QGIS scales loaded rasters by a cumulative count out approach (98%). As the height and aspect layers are filled with zeros where no wall are present it might appear as if there is no walls identified. Rescale your results to see the walls identified (Layer Properties > Symbology).
Fig. 111 Settings for the Wall height and aspect plugin.
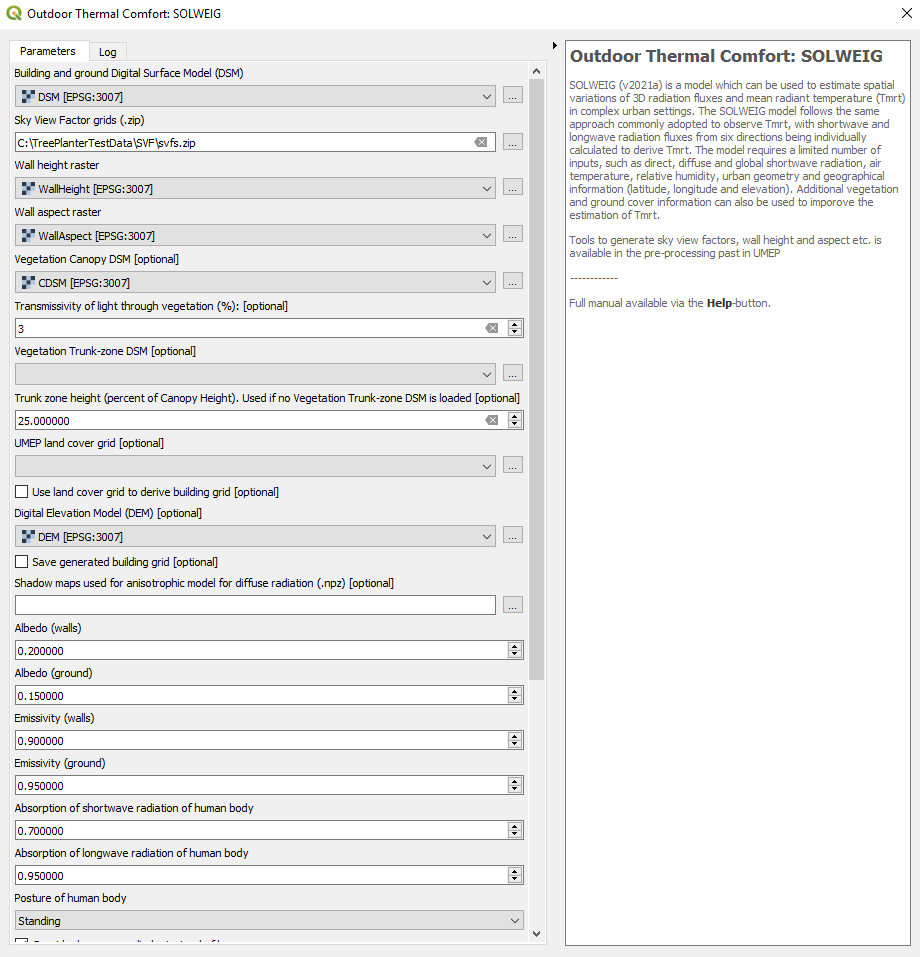
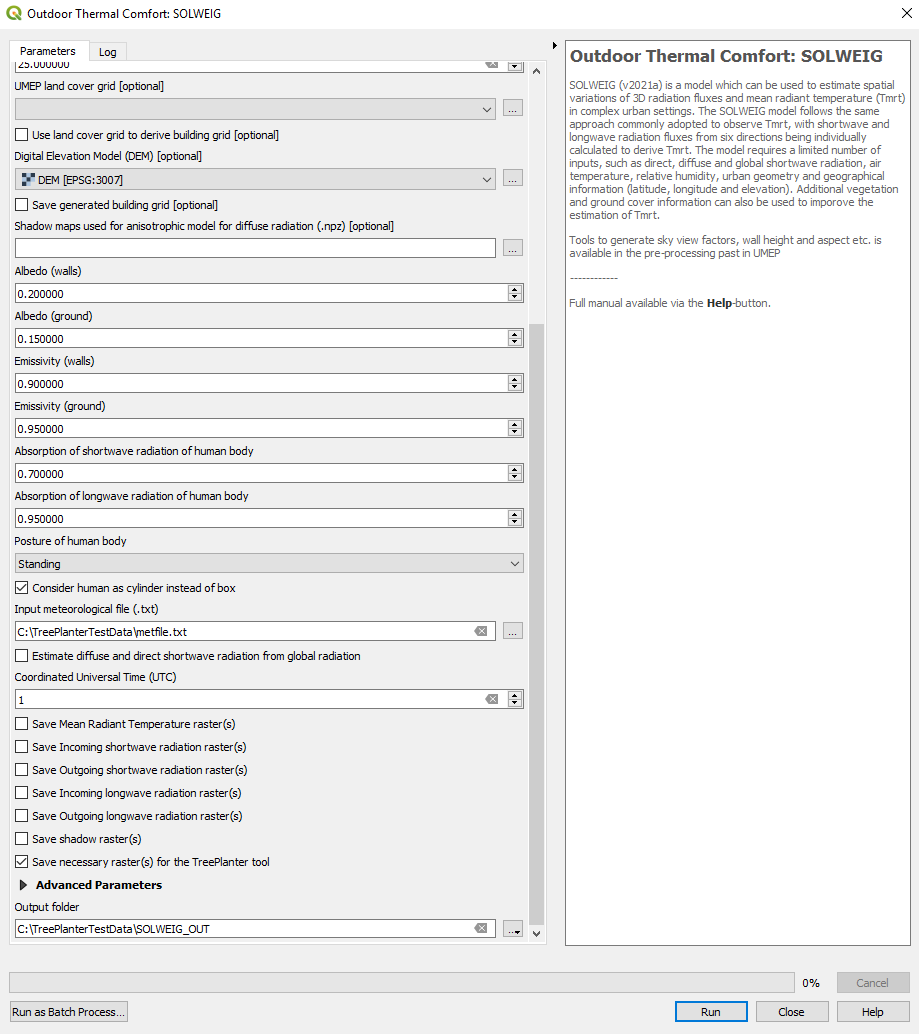
Re-open the SOLWEIG plugin and use the settings shown below (see both figures). Do not
forget to tick Save necessary raster(s) for the TreePlanter tool. Click Run.
Fig. 112 The settings for your SOLWEIG run (click on figure for larger image).
Fig. 113 Continuing.. The settings for your SOLWEIG run (click on figure for larger image).
Examine the output (Average Tmrt (°C). What is the main
driver to the spatial variations in Tmrt?
Now you will run TreePlanter based on the output from the SOLWEIG run
in the previous section.
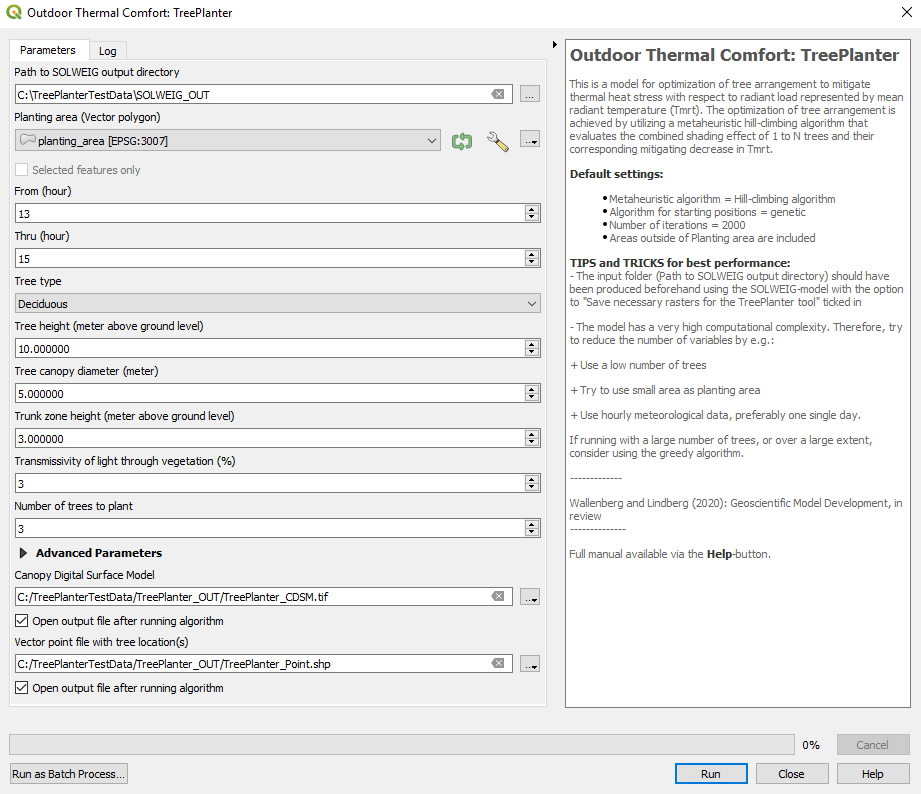
You will use planting_area.shp as input Planting area. Everything else will
be left as default. Use the settings shown below. With these settings, you will
find optimal locations for three deciduous trees based on Tmrt
between 13.00 - 15.00 LST. The trees are 10 m high, with a 5 m canopy diameter
and 3 m trunk zone. Click Run.
When the model run is finished, you should have one CDSM (raster) and
one vector point file. Included in the CDSM are the existing vegetation and the
three new trees, which can be used as input in SOLWEIG. The vector point file
contains the positions for the new trees.
It is possible to change number of iterations under Advanced Parameters. Number
of iterations can increase the accuracy of the model. It is also possible to run the
model with the greedy algorithm.
Run TreePlanter with the greedy algorithm to find locations for 20 trees.
Next step is to run SOLWEIG again, but with the newly created CDSM including the
new trees from the TreePlanter run where you used the hill-climbing algorithm.
In order to do this you first have to do the following:
Re-calculate sky view factors with the CDSM including the new trees
Run SOLWEIG with new CDSM and new sky view factors
Compare your results with the results from your first SOLWEIG run. Did the trees
end up in locations where their canopies block incoming solar radiation and
mitigate high Tmrt? Do the locations seem to be optimal?
Wallenberg N, Lindberg, F & Rayner, D: Locating trees to mitigate outdoor radiant load of humans in
urban areas using a metaheuristic hill climbing algorithm - Introducing TreePlanter v1.0. Geoscientific Model Development.