Introduction to UMEP and the QGIS Processing framework
Note
It’s preferable that the tutorial: Solar Energy - Introduction to SEBE is completed before this.
Introduction
UMEP for Processing ports many of the UMEP tools to the QGIS processing framework, which is a geoprocessing environment that can be used to call native and third-party algorithms from QGIS, making your spatial analysis tasks more productive and easy to accomplish. You can, for example, call the UMEP tools directly as functions in a Python script or include them in the Graphical Modeler in QGIS.
Many of the analysis carried out in UMEP has to be set up as a workflow where one or many tools has to be executed in sequence in order to reach a final result. In this tutorial we will make use of the example of the model Solar Energy on Building Envelopes (SEBE) which can be used to estimate incoming solar radiation on roofs, walls and ground in urban environments. The figure below shows the workflow that needs to be considered to reach the final result.
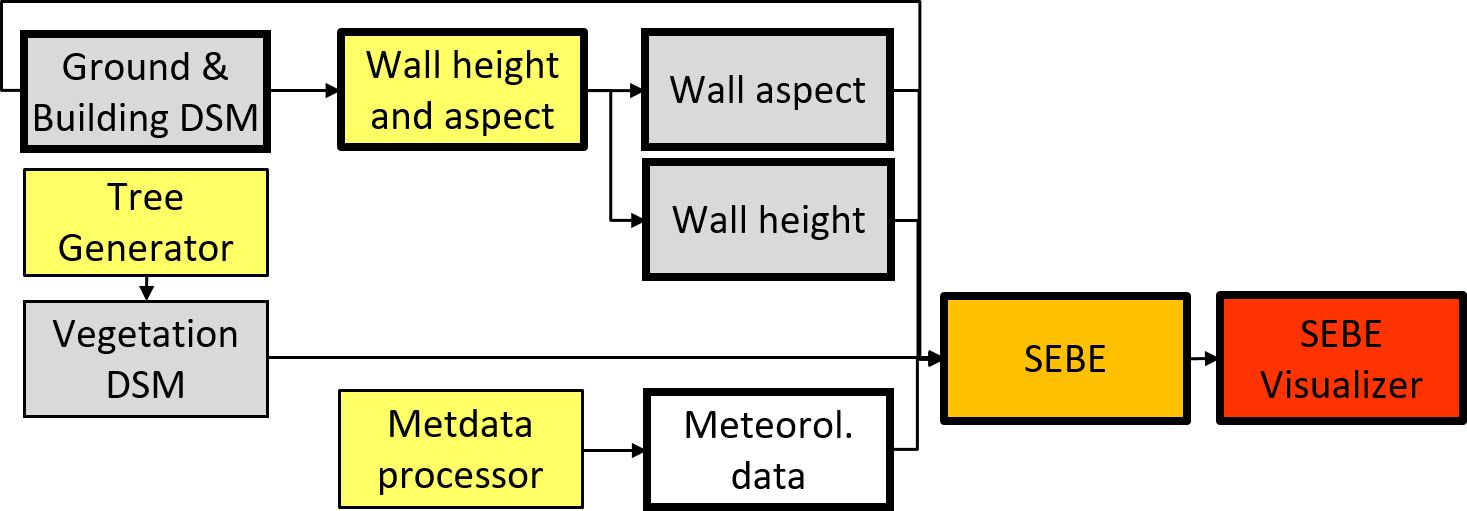
Fig. 140 Workflow and geodata used for analysing solar irradiance on building envelopes using the SEBE model. Bold outlines are mandatory items. Yellow, orange and red indicates pre-processor, processor and post-processor tools in UMEP, respectively. Grey boxes indicate geodatasets.
In this tutorial you will only make use of the mandatory steps (bold outlines).
Steps
To explore how UMEP can be used within the Processing Toolbox in QGIS
Create a workflow model for solar radiation modelling in UMEP
Explore the possibilities of using Python for UMEP and QGIS
Installing UMEP for Processing
Installing a processing plugin is done in same way as any other plugin in QGIS:
UMEP for processing (Experimental and not complete) is available from Plugins -> Manage and Install Plugins… in the menu bar in QGIS. Remember to tick in show also experimental plugins under the Settings-tab.
Under the All-tab, search for UMEP for processing, click on it and then Install Plugin.
If installed succesfully, You will now see UMEP in the Processing Toolbox-panel to the right in QGIS.
Data for this Tutorial
You will make use of the same dataset used in the tutorial Solar Energy - Introduction to SEBE. The geodata covers a small area in central Gothenburg, Sweden. Data are projected in SWEREF99 1200 (EPSG:3007) which is the Swedish national coordinate system.
UMEP for processing: First example
The tools in UMEP for processing are the same as in UMEP found in the menubar. However, it is not as complete, as some tools are not suitable to be used within the processing framework in QGIS. As a first example you will explore the Wall Height and Aspect tool.
Add DSM_KRbig.tif to your project.
In the Processing Toolbox, Open UMEP -> Pre-Processor -> Urban Geometry: Wall Height and Aspect.
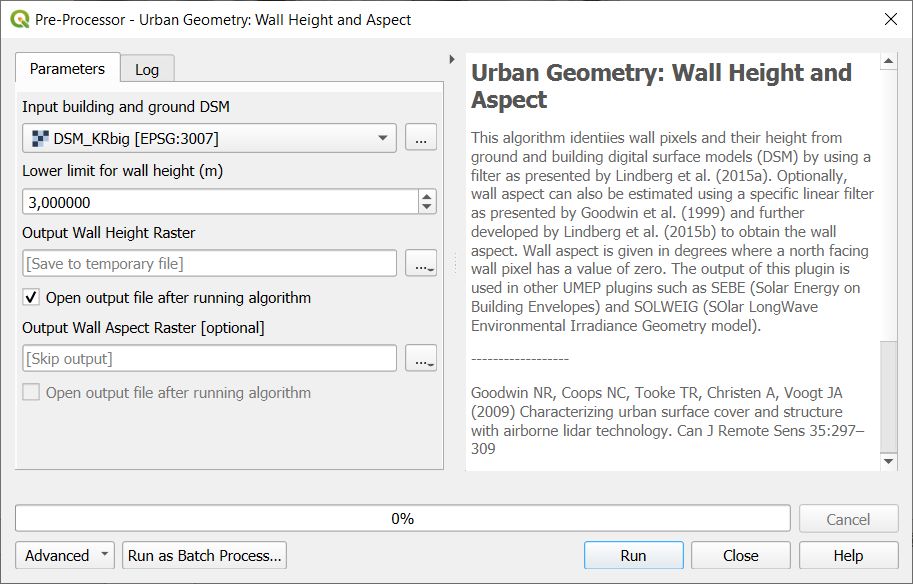
Fig. 141 The Wall Height and Aspect tool opened from the QGIS Processing Toolbox.
If you also open the same tool but from the menubar you will see that is is the same tool but with a different graphical user interface design (buttons, windows etc don’t look the same). One feature of the tools in the Processing toolbox is that their apperance is almost the same. Technically, they also work in a similar way by being designed as tools that can be executed in a similar way. That will come in handy later on when you want to make use of tools in an automated Python script.
Now, without making and changes, just click Run in the Wall Height and Aspect tool opened from the Processing toolbox and see the results appearing in the Map canvas and the Layer-panel to the left.
Before closing the tool, take a look in the log-window. Here you see some useful information e.g. if the tool was finished sucesfully, but also the name of all the input parameters:
Input parameters:
{ 'INPUT' : 'C:/Users/xlinfr/Desktop/Goteborg_SWEREF99_1200/Goteborg_SWEREF99_1200/DSM_KRbig.tif',
'INPUT_LIMIT' : 3,
'OUTPUT_ASPECT' : 'TEMPORARY_OUTPUT',
'OUTPUT_HEIGHT' : 'TEMPORARY_OUTPUT' }
Now close the Wall Height and Aspect tool and remove the height and aspect rasters from your QGIS project.
Creating a SEBE workflow using the Graphical Modeler
A very common feature in GIS software systems is a graphical modeler where processes in many steps can be set up in a non-programming fashion. QGIS also has a tool like this and you will now make use of it to preform basic solar radiation modelling using the SEBE model.
Open the Graphical Modeler, either from the menubar (Processing > Graphical Modeler…) or through the button with three gears at the top of the Processing Toolbox-panel (Create New Model…).
Take a look at the first figure in this tutorial to see the steps needed. We will keep it simple and leave out vegetation for now. First you need to create rasters for wall height and aspect before you can execute the main model.
In the Algorithms-tab in the upper left panel, locate UMEP and open Wall Height and Aspect from the Pre-Processor. Configure the settings as shown below and then click OK:
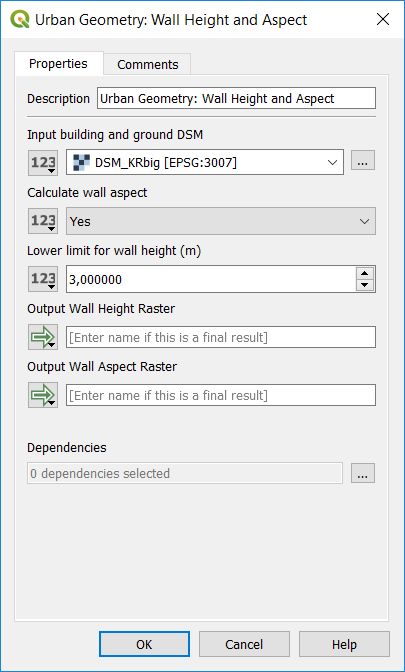
Fig. 142 Settings for the Wall Height and Aspect tool.
Now you can see the tool visible in the main modeler window.
In the Algorithms-tab, locate and open Solar Energy on Building Envelopes from the Processor. Leave all settings as default but change the following:
Set the Input building and ground DSM to DSM_KRbig.tif
Wall height raster should be an Algorithm Output. This is changed by clicking the button to the left of the Wall height raster selection bar. Choose the height raster from the Wall Height and Aspect-tool added before.
Do the same for the Wall aspect raster but now choose the aspect raster from Wall Height and Aspect-tool.
Change UTC to 1.
Add an Input Meteorological File (GBG_TMY_1977.txt found in the input data for this tuorial).
Add an Output folder (e.g. your Desktop). You need to choose Value from the button left of the Output folder-window.
When all changes are made, click OK.
Now two steps (boxes) are shown in the main Modeler window.
Under Model Properties, Change Name to SEBEProcessing and Group to My UMEP Models
Save model as SEBEProcessing.model3 and locate it in the folder recommend by QGIS (C:/Users/your_user_name/AppData/Roaming/QGIS/QGIS3/profiles/default/processing/models). Then you will easily be able to locate the model from the Processing Toolbox later.
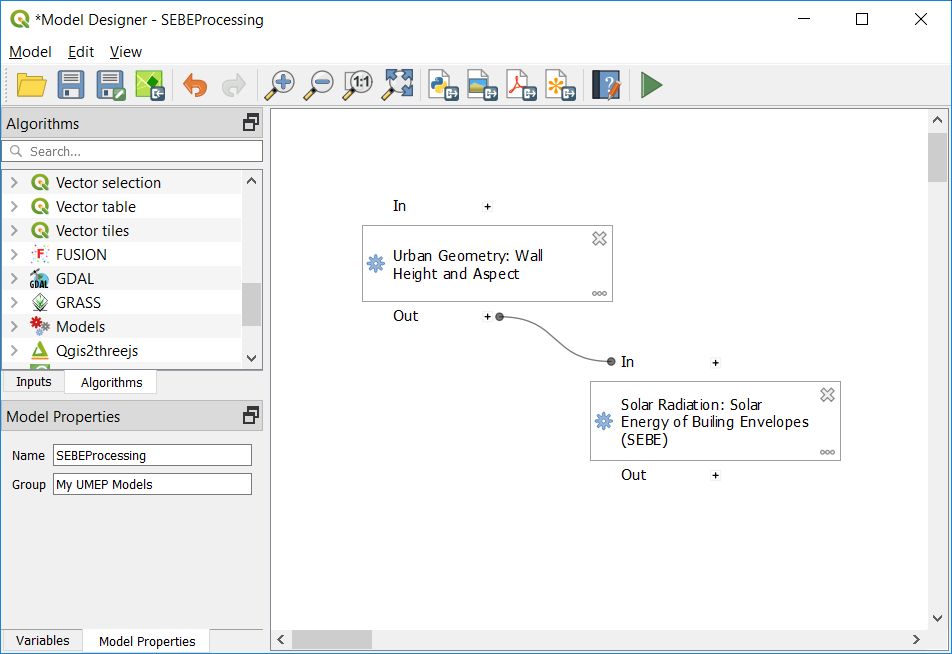
Fig. 143 The SEBEProcessing model in the Graphical Modeler in QGIS.
Now click the Green arrow (Run Model) in the Modeler tool.
Click Run and the process begins. You can follow its progress in the log window.
When finished, examine the outputs in your output folder. Three files should be present (Energyyearwall.txt, Energyyearroof.tif and dsm.tif)
If you encounter the following error:
Traceback (most recent call last):
File "C:/Users/user_name/AppData/Roaming/QGIS/QGIS3\profiles\default/python/plugins\processing_umep\processor\sebe_algorithm.py", line 157, in processAlgorithm
provider = dsmlayer.dataProvider()
AttributeError: 'NoneType' object has no attribute 'dataProvider'
Try simply running the model again and it should work.
Imagine that you now want to change input information for this model workflow. This is done by exposing input and output parameters for the user to alter (i.e. you or others). Lets now expose Input DSM, Input Meterological data, UTC, Albedo and Output folder.
In the Inputs-tab in the upper left panel in the Model Designer, add a Raster Layer. Describe it as a DSM. Tick in Mandatory. Click OK
Now a Yellow box called DSM is visible in your main design window.
Double-click on the Wall Height and Aspect tool and change the Input building and ground DSM to a Model Input and choose your DSM in the scroll-down list.
Now you see that your DSM is connected to the Wall Height and Aspect tool and if you Run the model (Green Arrow) you see that you have an option to change the input raster layer.
Now add the other parameters (Input Meterological data, UTC, Albedo and Output folder) the same way. Input Meterological data should be File/Folder (text-file) and Albedo (float: 0-1, default: 0.15) and UTC (integer: -12 - 12, default: 0) should be Number.. All inputs should be marked as Mandatory.
Also remember to set the DSM input for the SEBE model. Use the same as for the input to the Wall Height and Aspect tool.
The output folder is set by simply typing Output folder in the Output Folder Window in the SEBE-tool window.
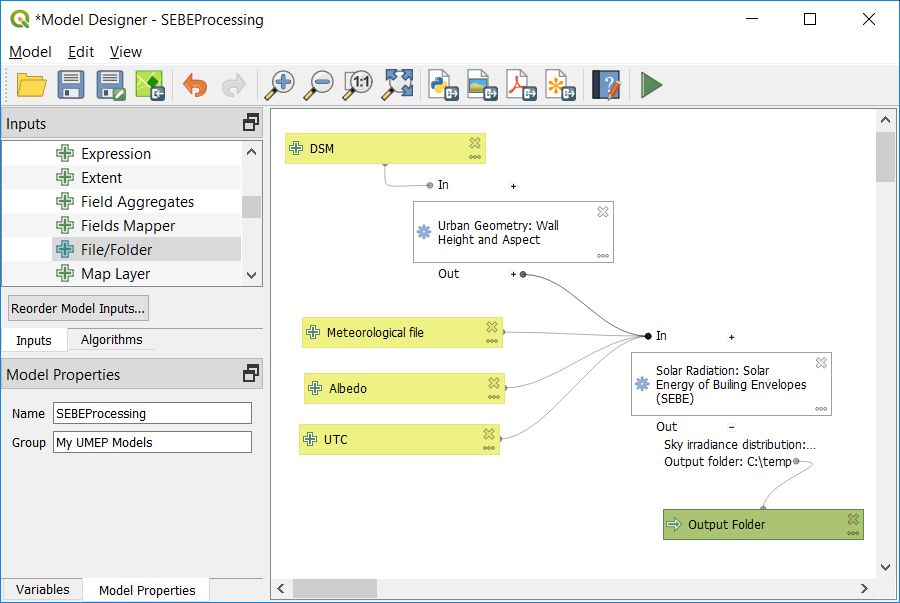
Fig. 144 The SEBEProcessing model with exposed input parameters in the Graphical Modeler in QGIS.
Save the model and run model again. Now you see all the parameters exposed in the model tool.
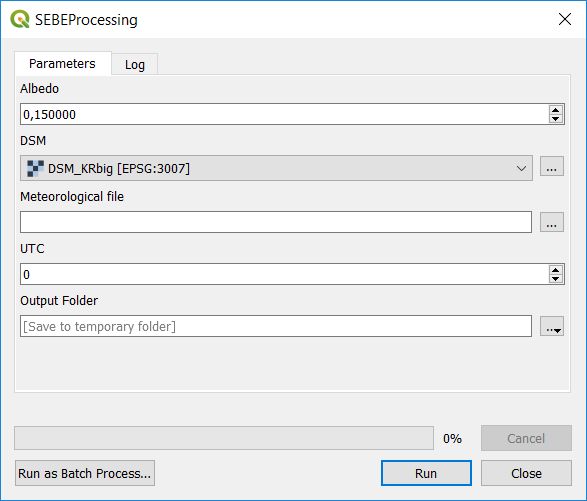
Fig. 145 The SEBEProcessing model shown as a processing tool.
As you have given your model a name and a group name, as well as saving it in the model-folder, you can now find it in the Processing Toolbox (Model > My UMEP Models > SEBEProcessing)
There are more functionalities available in the Graphical Modeler. See e.g. the QGIS documentation if you are interested. Using the Graphical Modeler is, in a way, very close to writing programming scripts. The next section will show how to access processing algorithms from the Python console in QGIS.
Accessing algorithms from the Python console
As you might have noticed, there are possibilities to export your model to a Python script from the menu bar in the Model Designer. This will only create a script to start up your model as seen in the Processing Toolbox which is not particularly useful. What would be more useful is to be able to run e.g. the Wall Height and Aspect tool, or even the model you just created, without using a graphical interface, i.e. from command line such as a Python console.
One easy way to do this is to look at the history actions in the Processing Toolbox (The clock at the top of the panel). Here you see the actual commands (syntax) to execute the algorithms/model available.
#. Locate the first time you ran Wall Height and Aspect in the History. Copy that line. Is should look some thing like this:
processing.run("umep:Urban Geometry: Wall Height and Aspect", {'INPUT':'C:/Users/xlinfr/Desktop/Goteborg_SWEREF99_1200/Goteborg_SWEREF99_1200/DSM_KRbig.tif','INPUT_LIMIT':3,'OUTPUT_HEIGHT':'TEMPORARY_OUTPUT'})
You may notice that the last part in curly brakets starting with ‘INPUT’: is your input parameters. The text before that is how you access the tool via Python.
Open the Python console in QGIS (Plugins > Python Console) and paste the line you just copied. Before you press return, change the output of the height raster to e.g. ‘C:/temp/heightraster.tif’. Press return. A new layer (heightraster.tif) should have been created.
Accessing algorithms in a stand-alone Python script
To access third party processing plugins (such as UMEP) in a stand-alone Python script, use the following lines of code (example for Windows users):
from qgis.core import QgsApplication
import sys

# Initiating a QGIS application
qgishome = 'C:/OSGeo4W/apps/qgis/'
QgsApplication.setPrefixPath(qgishome, True)
app = QgsApplication([], False)
app.initQgis()

# import third party processing plugins
sys.path.append(r'C:\Users\ **your_username** \AppData\Roaming\QGIS\QGIS3\profiles\default\python\plugins')
from processing_umep.processing_umep_provider import ProcessingUMEPProvider
umep_provider = ProcessingUMEPProvider()
QgsApplication.processingRegistry().addProvider(umep_provider)
This was of cource a very brief introduction on how to use Python in QGIS. In future tutorials you will learn how to create more extensive Python scripts and really make your GIS processing capabilities a powerful tool
Tutorial finished.