The first part of this tutorial is designed for a Linux/Unix/Mac type of OS. For Windows users, first have a look at this tutorial and the last part of this tutorial
If you use Python in a specific Python environment, make sure it is the same as the one you use when you run UMEP within the QGIS interface.
1. Makes QGIS functions accessible from standalone Python scripts
To use QGIS functions in your Python scripts, you need to add the following at the beginning of your Python script:
# Necessary importsfromqgis.coreimportQgsApplication# Starts the qgis application without the graphical user interfacegui_flag=Falseapp=QgsApplication([],gui_flag)app.initQgis()# Then you prepare the processing framework to access all default QGIS processing functionfromprocessing.core.ProcessingimportProcessingProcessing.initialize()
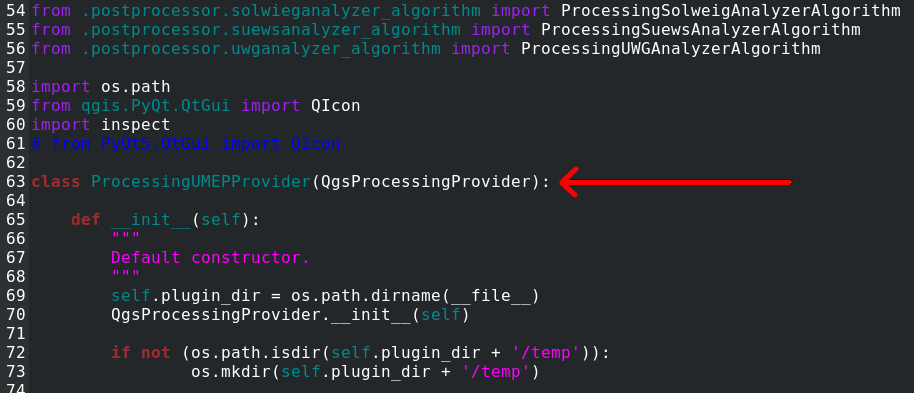
You can now call QGIS processes in your script. All processes ? No, actually for QGIS plugin processes, you need to import them first. In the plugin directory (probably ‘/home/ __your_username__ /.local/share/QGIS/QGIS3/profiles/default/python/plugins’ for linux users and ‘C:\Users\ __your_username__ \AppData\Roaming\QGIS\QGIS3\profiles\default\python\plugins’ for Windows users), go to the plugin directory you want to use (for example ‘processing_umep’ for UMEP), open the Python file called (’ __anyname__ _provider.py’ for our example) and get the name of the class (here ‘ProcessingUMEPProvider’).
Fig. 150 Example of provider class (click on figure for larger image)
Along with this information, you need to add the following lines in your Python script to import the plugin processes in the QGIS factory of processes:
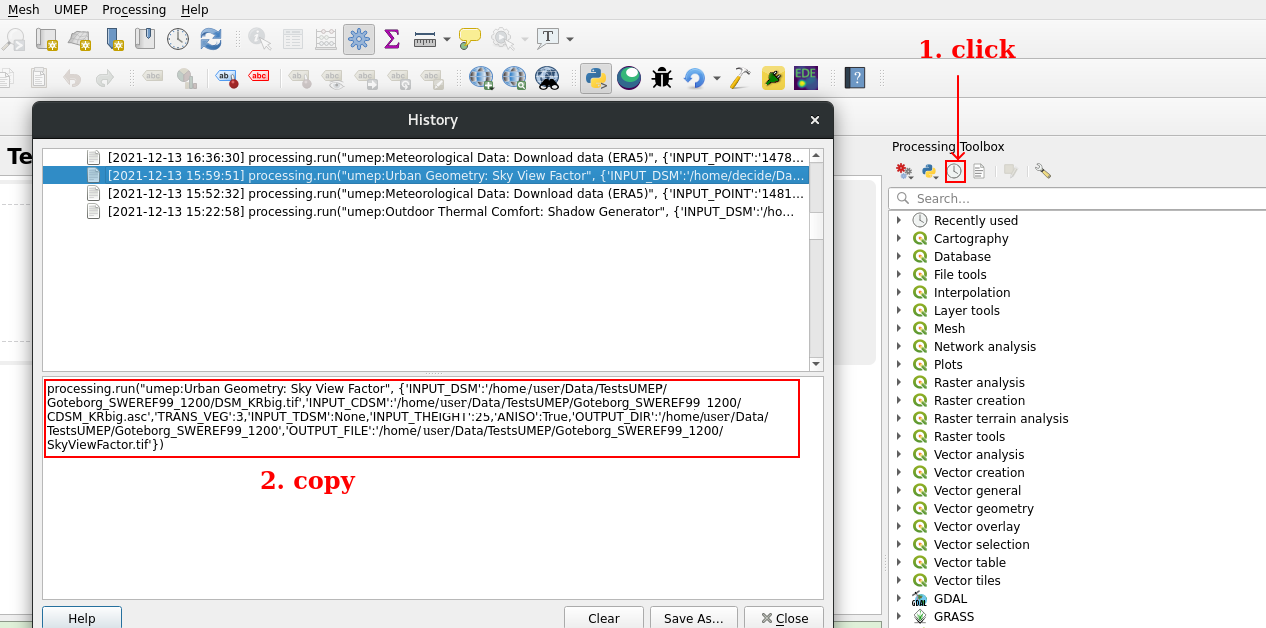
Finally, you just need to call the process using the right Python processing command. To know how to call a specific process, the easiest way is to run it within the QGIS interface first and then copy and paste the content of the history log into your script.
Fig. 151 How to get all needed inputs for a given processing (click on figure for larger image)
Before to run it in your Python script, you need to import the module ‘processing’:
importprocessing
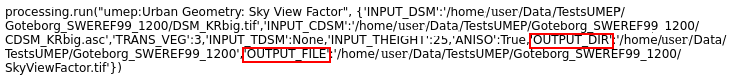
You can then adapt the values of the dictionary in your own script. This command will return a dictionary of outputs from the process you run. You can then use these outputs to connect processes between each other (e.g. in the previous example you get a dictionary with two outputs: ‘OUTPUT_DIR’ and ‘OUTPUT_FILE’).
Fig. 152 Name of the processing outputs (click on figure for larger image)
At the end of your script, do not forget to end the connection to the QGIS session by adding the following:
app.exitQgis()
Now that all needed processes can be run from your Python script, let’s apply and connect some of them.
In this example, we will compute the mean radiant temperature for a given area. Thus we will need to produce the SOLWEIG inputs using the ‘Sky View Factor’ and ‘Wall height and Aspect’ preprocessors and then connect their outputs to the SOLWEIG processor. These processors are only UMEP ones, thus in order to illustrate that you can connect them to other QGIS processes, we will first crop the data in order to minimize the size of the study area using the GDAL ‘Clip raster by mask layer’ process.
The UMEP tutorial datasets can be downloaded from our here repository
here.
Download and extract the raster layers (DSM, CDSM, DEM and land cover) and the vector mask layer (mask_layer) from the Goteborg folder into the folder of your choice (keep the folder directory, you will need it later on).
If you want to know what you have downloaded:
Open the data into QGIS:
Create a new project
Examine the geodata by adding the layers to your project:
for DSM_KRbig, CDSM_KRbig, DEM_KRbig and landcover: *Layer > Add Layer > Add Raster Layer
for mask_layer.shp: *Layer > Add Layer > Add Vector Layer
Coordinate system of the grids is Sweref99 1200 (EPSG:3007). If you
look at the lower right hand side you can see the CRS used in the
current QGIS project.
Examine the different datasets before you move on.
To add a legend to the land cover raster you can load
landcoverstyle.qml found in the test dataset. Right click on the
land cover (Properties -> Style (lower left) -> Load Style).
Then define in your Python script the location of the input needed data (where you have extracted the data) and where it will be saved
# Input files definitioninput_directory=" **directoryofyouchoice** "input_mask="mask_layer.geojson"input_cdsm='CDSM_KRbig.asc'input_dsm='DSM_KRbig.tif'input_dem='DEM_KRbig.tif'input_landcover='landcover.tif'input_meteo='gbg19970606_2015a.txt'# Defines an output directory where will be stored your outputs (and intermediate results)output_dir=" **directoryofyouchoice** "
First, we want crop the raster files to limit the size of study area by using the vector mask. Only the ‘.asc’ file need ‘SOURCE_CRS’ and ‘TARGET_CRS’ specified since it does not contain any coordinate system information.
# Set the EPSG code for the .asc file which has no EPSGfromqgis.coreimportQgsCoordinateReferenceSystemcdsm_epsg=QgsCoordinateReferenceSystem('EPSG:3007')input_cdsm_filename=input_cdsm.split(".")[0]crop_cdsm=processing.run("gdal:cliprasterbymasklayer",{'INPUT':os.path.join(input_directory,input_cdsm),'MASK':os.path.join(input_directory,input_mask),'SOURCE_CRS':cdsm_epsg,'TARGET_CRS':cdsm_epsg,'NODATA':None,'ALPHA_BAND':False,'CROP_TO_CUTLINE':True,'KEEP_RESOLUTION':True,'SET_RESOLUTION':False,'X_RESOLUTION':None,'Y_RESOLUTION':None,'MULTITHREADING':False,'OPTIONS':'','DATA_TYPE':0,'EXTRA':'','OUTPUT':os.path.join(output_dir,"Crop_"+ \
input_cdsm_filename+".tif")})input_dsm_filename=input_dsm.split(".")[0]crop_dsm=processing.run("gdal:cliprasterbymasklayer",{'INPUT':os.path.join(input_directory,input_dsm),'MASK':os.path.join(input_directory,input_mask),'SOURCE_CRS':None,'TARGET_CRS':None,'NODATA':None,'ALPHA_BAND':False,'CROP_TO_CUTLINE':True,'KEEP_RESOLUTION':True,'SET_RESOLUTION':False,'X_RESOLUTION':None,'Y_RESOLUTION':None,'MULTITHREADING':False,'OPTIONS':'','DATA_TYPE':0,'EXTRA':'','OUTPUT':os.path.join(output_dir,"Crop_"+ \
input_dsm_filename+".tif")})input_dem_filename=input_dem.split(".")[0]crop_dem=processing.run("gdal:cliprasterbymasklayer",{'INPUT':os.path.join(input_directory,input_dem),'MASK':os.path.join(input_directory,input_mask),'SOURCE_CRS':None,'TARGET_CRS':None,'NODATA':None,'ALPHA_BAND':False,'CROP_TO_CUTLINE':True,'KEEP_RESOLUTION':True,'SET_RESOLUTION':False,'X_RESOLUTION':None,'Y_RESOLUTION':None,'MULTITHREADING':False,'OPTIONS':'','DATA_TYPE':0,'EXTRA':'','OUTPUT':os.path.join(output_dir,"Crop_"+ \
input_dem_filename+".tif")})input_landcover_filename=input_landcover.split(".")[0]crop_landcover=processing.run("gdal:cliprasterbymasklayer",{'INPUT':os.path.join(input_directory,input_landcover),'MASK':os.path.join(input_directory,input_mask),'SOURCE_CRS':None,'TARGET_CRS':None,'NODATA':None,'ALPHA_BAND':False,'CROP_TO_CUTLINE':True,'KEEP_RESOLUTION':True,'SET_RESOLUTION':False,'X_RESOLUTION':None,'Y_RESOLUTION':None,'MULTITHREADING':False,'OPTIONS':'','DATA_TYPE':0,'EXTRA':'','OUTPUT':os.path.join(output_dir,"Crop_"+ \
input_landcover_filename+".tif")})