Note
Need help? Please let us know in the UMEP Community.
5.7. Urban Heat Island: TARGET Analyser
Note
Please report any issues to our code repository.
- Contributor
Name
Institution
Fredrik Lindberg
Gothenburg
- Introduction
TARGET (The Air-temperature Response to Green blue-infrastructure Evaluaition Tool) is a simple modelling framework used to examine intra urban climate (102 m resolution). It has specifically been developed as an efficient, easy-to-use model albe to investigate heat mitigation effects of green and blue infrastructure within urban areas but can also be used to model the canopy urban heat island (Broadbent et al. 2019)
The TARGET Analyser plugin can be used to make basic spatial analysis and plot model results generated by the TARGET plugin in UMEP for processing. This plugin is availabe both from UMEP for processing and the regular menu-based UMEP plugin. The plotting capabilities are only available in the latter.
- Dialog box
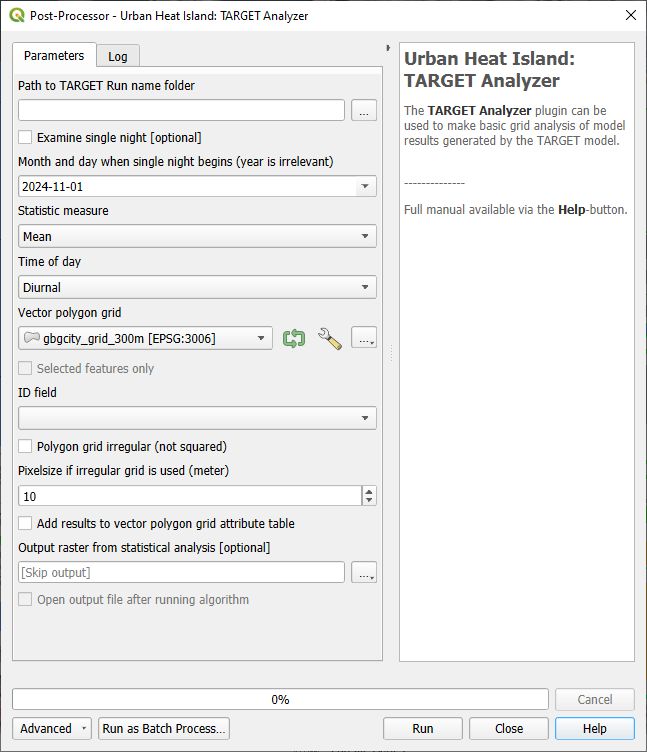
Fig. 5.9 The dialog for the TARGET Analyser in UMEP for processing. Click on image for enlargement.
- Parameters
Path to TARGET Run name folder
This was set when running TARGET from the Processor.
Examine single night
Tick this in if you want to examine air temperature variations for a specific night.
Month and day when single night begins
Specify the single date that should be examined. The nocturnal hours from following day will be included. The date specified must be within the days modelled in TARGET.
Statistic measure
Choose how Ta differences between forcing data and modelled data should be represented, e.g. mean, max etc.
Time of day
Specify when times that should be included in the staistical calculation above.
Vector polygon grid
The vectory polygon grid that depicts the modelling area(s). This should be the same polygon layer that was used in TARGETPrepare and TARGET.
ID field
Choose the attribute from the selected polygon layer that was used to separate the different polygon objects from each other in TARGETPrepare and TARGET.
Polygon grid irregular (not squared)
Tick this in if a grid is irregular i.e. not squared and aligned north to south.
Pixel resolution (m)
When a irregular grid is used, a pixel resolution in meters must be specified.
Add results to vector polygon grid attribute table
Tick this in if you like to add UHI statistics in the attribute table of your polygon grid
Output raster from statistical analysis
Specify the location of the geotiff that will be created from the analysis
Open output file after runing algorithm
The geotiff generated will be added to your QGIS project
- Run
Starts the algorithm.
- Help
Link to this manual page.
- Close
Closes the plugin.
- Remarks
This is a very simple tool for generating spatial information from the TARGET model.
In the menu-based UMEP tool there is also possibility to plot time series of air temperature differences for specific grids as well as specify specific days to examine.