Note
Need help? Please let us know in the UMEP Community.
3.3. Meteorological Data: MetPreprocessor
- Contributor:
Name
Institution
Fredrik Lindberg
Gothenburg
- Introduction
MetPreprocessor can be used to transform required temporal meteorological data into the format used in UMEP. The following variables are usually required as a minimum: air temperature, relative humidity, barometric pressure, wind speed, incoming shortwave radiation and rainfall; if available, other variables can be supplied as well.
Input data can include any number of header lines and should be separated by conventional separators (e.g. comma, space, tab, etc). The output format is space-separated and includes time-related variables of year, day of year, hour and minute. The plugin is able to process other input time formats including month, day of month, etc. Possibility to use an EnergyPlus Weather (.epw) is also available. Note that .epw-files rarely have precipitation data included. This is is required for SUEWS-modelling and need to be acquired from elsewhere (external dataset).
Dialog box
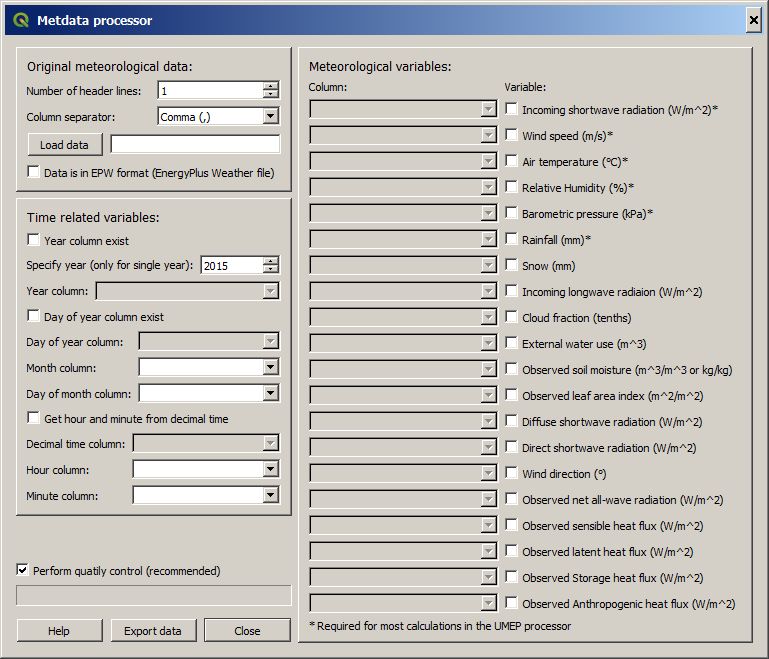
Fig. 3.4 Interface for inputting an ascii data file into the correct format for UMEP. Click on image for enlargement.
Dialog sections
top left |
Select an existing text file with meteorological data at a temporal resolution between 5 min and 180 min (3 hours) that is divisible by 5 min. Tick in EPW box to convert an EnergyPlus Weather file. |
middle left |
Specify time-related columns in the imported data file. |
lower left |
Perform quality control (recommended): Select to perform a simple quality control which will check the input data for unreasonable values of each variable. |
right |
Choose columns from imported data file that correspond to the meteorological variables used in UMEP. |
- Variables included in UMEP meteorological input file
if acceptable range is not reasonable (i.e. beyond the limits we have set) please contact
No. |
Header name |
Description |
Accepted range |
Comments |
|---|---|---|---|---|
1 |
iy |
Year [YYYY] |
Not applicable |
|
2 |
id |
Day of year [DOY] |
1 to 365 (366 if leap year) |
|
3 |
it |
Hour [H] |
0 to 23 |
|
4 |
imin |
Minute [M] |
0 to 59 |
|
5 |
qn |
Net all-wave radiation [W m-2] |
-200 to 800 |
|
6 |
qh |
Sensible heat flux [W m-2] |
-200 to 750 |
|
7 |
qe |
Latent heat flux [W m-2] |
-100 to 650 |
|
8 |
qs |
Storage heat flux [W m-2] |
-200 to 650 |
|
9 |
qf |
Anthropogenic heat flux [W m-2] |
0 to 1500 |
|
10 |
U |
Wind speed [m s-1] |
0.001 to 60 |
|
11 |
RH |
Relative Humidity [%] |
5 to 100 |
|
12 |
Tair |
Air temperature [°C] |
-30 to 55 |
|
13 |
pres |
Surface barometric pressure [kPa] |
90 to 107 |
|
14 |
rain |
Rainfall [mm] |
0 to 30 |
(per 5 min) this should be scaled based on time step used |
15 |
kdown |
Incoming shortwave radiation [W m-2] |
0 to 1200 |
Global irradiance on the horizontal plane |
16 |
snow |
Snow [mm] |
0 to 300 |
(per 5 min) this should be scaled based on time step used |
17 |
ldown |
Incoming longwave radiation [W m-2] |
100 to 600 |
|
18 |
fcld |
Cloud fraction [tenths] |
0 to 1 |
|
19 |
wuh |
External water use [m3] |
0 to 10 |
(per 5 min) scale based on time step being used |
20 |
xsmd |
(Observed) soil moisture |
0.01 to 0.5 |
[m3 m-3 or kg kg-1] |
21 |
lai |
(Observed) leaf area index [m2 m-2] |
0 to 15 |
|
22 |
kdiff |
Diffuse shortwave radiation [W m-2] |
0 to 600 |
Diffuse irradiance on the horizontal plane |
23 |
kdir |
Direct shortwave radiation [W m-2] |
0 to 1200 |
Beam/direct irradiance on a plane always normal to sun rays. One way to check this is to compare direct and global radiation and see if kdir is higher than global radiation during clear weather. |
24 |
wdir |
Wind direction [°] |
0 to 360 |
- Remarks
If decimal time is ticked in, day of year column must be stated and the decimal time column should be numbers between 0 and 1.
If you have problems with importing a dataset. Do a time series plot using small points. Check (1) are there any data gaps (there can be no gaps) (2) are the columns lined up throughout the data setes (e.g if variable suddenly changes incorrectly, you may have columns misaligned).
- Gapfilling - there are a number of techniques that can be used for this e.g.:
Linear fit between one or two missing periods using the data on either
Create diurnal average for each variabel for short periods (e.g. 2 weeks) and use these values to fill missing data